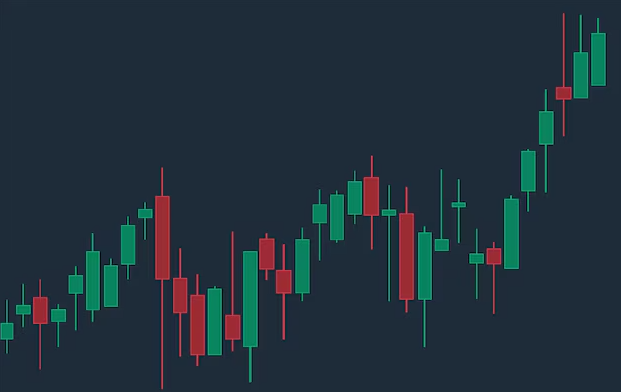
Support and resistance in crypto charts mark price zones where buyers pause and sellers step in. These levels arise from crowd testing, price action, and recurring structure, often visible through volume spikes and liquidity pockets. Real-time spotting favors dynamic zones over fixed lines, with confluence from trendlines and momentum lending context to reactions. Traders use these cues to time entries, manage risk, and align with broader cycles, leaving the next move contingent on what comes into play next.
Understanding Crypto Support and Resistance
Support and resistance are key price levels where crypto assets repeatedly pause or reverse after moves, forming the foundation for many technical strategies.
The analysis centers on price action and pattern responses, mapping where reactions occur.
Chart views reveal trend dynamics, with discrete zones guiding entries and exits.
Quantified signals emerge from alignments between price action, local highs/lows, and momentum.
See also: bbwtech
Why S/R Forms: Psychology, Volume, Structure
Why do support and resistance forms arise in crypto charts? They reflect collective behavior: psychology dynamics drive crowds to test price levels, while volume cues confirm participation and conviction. Structural patterns emerge from repeated interactions across time, revealing zones of supply and demand. Data-driven interpretation emphasizes price reactions, liquidity, and trend context, enabling disciplined, freedom-centered trading decisions without overfitting.
Spotting S/R in Real Time: Tools and Patterns
Real-time spotting of support and resistance combines algorithmic cues with visual pattern recognition to locate actionable zones as prices move. The approach emphasizes objective indicators, price clustering, and dynamic zones rather than fixed lines.
Traders monitor real time alerts alongside cluster density, volume bursts, and confluence with trendlines, ensuring rapid confirmation of breakouts or reversals in volatile markets.
Trade With S/R: Setups, Risk, and Cycle Adaptation
Can S/R levels be translated into actionable trade setups that balance risk and adaptability across market cycles? Trade With S/R translates signals into disciplined entries and exits, focusing on trend validation and disciplined risk sizing.
Chart-focused analysis shows setups tighten near key levels, with stop placement just beyond support or resistance. Adaptation arises from cycle-aware position sizing and objective risk controls.
Conclusion
In sum, crypto support and resistance zones act as subtle, data-driven guardrails rather than rigid lines. Market participants test these levels through measured price action, with volume and structure clues guiding interpretation. Real-time spotting emphasizes dynamic zones and confluence, not absolutes. When integrated into a disciplined, chart-focused approach, S/R informs cautious entries, prudent exits, and adaptive risk management aligned with broader cycles. This measured framing helps traders navigate volatility without overcommitting to any single outcome.
